Bellevue vs. Seattle: Which One Fits How You Live?
If you're weighing Bellevue against Seattle, the honest answer is that it's rarely a question of which city is "better." It's a question of how you want your days to run and where you want your monthly dollars to go. Here's how the numbers and the day-to-day tradeoffs line up right now, using data I pulled this week.
The starting point: rates and prices
Freddie Mac's weekly survey put the 30-year fixed rate at 7.18% as of November 5, its third straight weekly decline. Every payment figure below uses that rate with 20% down, so treat them as illustrations, not quotes.
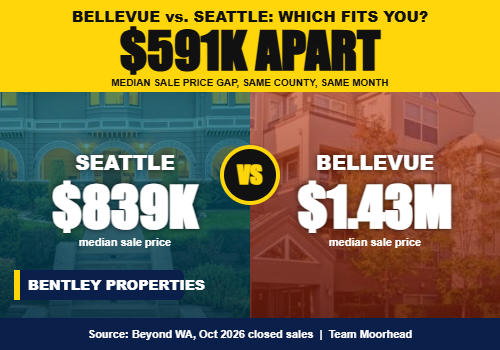
Using Beyond WA's October 2026 figures, the median sale price in Bellevue was $1,430,000 (down 12.7% from a year earlier), while Seattle's was $838,750 (flat year over year). Other sources calculate Seattle a little differently. The Madrona Group, using NWMLS data, shows $895,000 for October, so it's worth knowing that "the median" moves a bit depending on who's counting. Either way, Bellevue's median sits well above Seattle's.
Housing type explains much of the gap
Part of that spread is simply what's being sold. Houses are a bigger share of the Bellevue mix and condos are a bigger share of Seattle's, so the headline medians aren't an apples-to-apples comparison. Splitting by type from the same Beyond WA reports:
- Houses: Bellevue $1,592,500 vs. Seattle $1,012,500
- Condos and townhomes: Bellevue $759,888 vs. Seattle $635,000
On a house, the Bellevue premium is large. On a condo or townhome, the two markets are much closer. If you're open to attached housing, the cost gap between the cities narrows considerably.
Price per square foot
Beyond WA's price-per-square-foot figures are based on active listings: about $655 in Bellevue and about $551 in Seattle. That's roughly 19% more per square foot in Bellevue. Because these come from asking prices rather than closed sales, use them as a directional guide. Closed-sale numbers from other sources can differ.
Property tax: Seattle's rate is higher, but the bill depends on the price
This one surprises people. Based on a summary of the 2026 King County Assessor levy rates, the rate per $1,000 of assessed value is about $9.91 in Seattle and about $7.43 in Bellevue. Rates vary by levy code within each city, so check the specific parcel.
Here's what that looks like if we simply apply those rates to the median prices above (assessed values often differ from sale prices, so this is only an illustration):
- House: roughly $11,800 a year in Bellevue vs. roughly $10,000 in Seattle
- Condo or townhome: roughly $5,600 a year in Bellevue vs. roughly $6,300 in Seattle
So the higher Seattle rate can make an attached home there carry a bigger tax bill than a comparable-priced one in Bellevue, while on a house the higher Bellevue price tends to win out.
What the monthly picture looks like
Pulling it together at 7.18% with 20% down, principal and interest plus property tax on the median house comes to about $9,600 a month in Bellevue and about $6,300 in Seattle. For the median condo or townhome, it's about $4,600 in Bellevue and about $4,000 in Seattle. That excludes insurance, HOA dues, and utilities, and your own numbers will depend on your down payment, credit, and the specific home. A lender can run real figures for you.
Commute and daily rhythm
Census-based figures for 2024 show an average commute of about 23.6 minutes for Bellevue workers and about 26 minutes for Seattle workers. A big share of workers in both cities work from home: about 35.6% in Bellevue and 34.8% in Seattle. Where they differ is how people get around. About 45.6% of Bellevue workers drove alone, compared with 36.7% in Seattle, where 11.9% commuted by public transit.
If you have a hybrid schedule, those averages matter less than where your office, or your most frequent trips, actually are. Test your own route at the hour you'd really travel before you decide.
Walkability and transit
Walk Score rates Seattle at 74 for walking, 60 for transit, and 71 for biking. Bellevue comes in at 41, 37, and 42. Those are citywide averages, and they hide a lot of variation: Walk Score lists some Bellevue neighborhoods, such as Crossroads and Northwest Bellevue, in the mid-60s, and Seattle has areas far below its citywide score. If errands on foot or a car-light routine matter to you, look at the specific block, not just the city.
Lot sizes and space
I don't have a verified, current citywide median lot size for either city, so I won't quote one. What I can say is that lot size varies widely block to block in both places, and it's one of the easiest things to check on any specific property through the King County Assessor's parcel records. Pair that with the housing-type split above: if a yard and room to spread out are priorities, the house-versus-condo numbers will shape your budget more than the city name will.
Market conditions today
Beyond WA shows Bellevue with about 4.8 months of supply and a median of 38 days active, and Seattle with 4.5 months of supply and 23 days. Both fall in what that source calls balanced territory. That generally means buyers have more room to compare and negotiate than in the tightest years, though individual homes still vary a lot.
A simple way to decide
- Look harder at Seattle if you want more walkable, transit-served daily life, or you're aiming for a house at a lower price point.
- Look harder at Bellevue if you prefer a more car-oriented layout, a shorter average commute to Eastside employers, or you're comparing condos and townhomes where the price gap is smaller.
- Look at both if your job is hybrid and your main question is monthly cost versus space.
None of this is tax, legal, or financial advice, and past numbers don't guarantee future results. Figures are medians and averages, so any individual home can land well above or below them.
If you'd like to compare specific neighborhoods in both cities side by side, reach out anytime to set up a quick call.
Sources (pulled November 9, 2026)
Freddie Mac Primary Mortgage Market Survey via AP/WCAX (Nov 5, 2026); Beyond WA Bellevue and Seattle market reports (October 2026 data); The Madrona Group Seattle report (Nov 5, 2026); King County Assessor 2026 levy rates as summarized by Maggie Sun Real Estate; Walk Score city pages; Data USA (Census ACS 2024).