Will Tech Layoffs Hurt Eastside Home Prices? (Part 1)
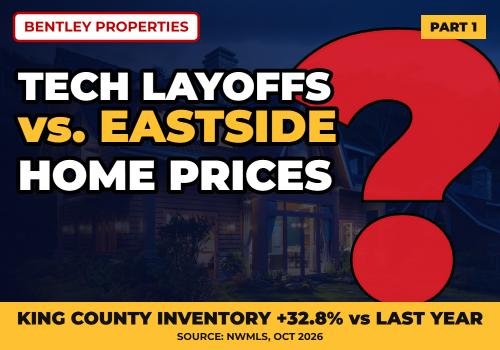
"Will the tech layoffs hurt Eastside home prices?" is probably the question I hear most from buyers and sellers right now. It's a fair one. So many Eastside households are tied to a handful of big employers that a layoff headline can feel like a housing headline. This is part 1 of what may become a short series. Today I want to lay out what's been announced, what the numbers did after earlier layoff waves, and which indicators I'd actually watch. I'm not going to predict where prices go from here, because nobody can do that reliably.
What's been announced recently
Here are the layoff items I could confirm from credible reporting, with dates:
- Amazon: A state filing disclosed on November 4, 2026 covered about 95 more Washington workers, in Seattle (67), Bellevue, Redmond, Sumner and Pasco. Spokesman-Review reporting notes Amazon has cut 4,858 corporate employees in Washington since the end of 2025, per state filings. That sits on top of the 14,000 U.S. cuts announced in October 2025, which KUOW reported included about 2,400 in Washington.
- Microsoft: A WARN notice filed in early July 2026 covered 605 positions in Redmond, part of a broader Xbox restructuring, with the cuts taking effect September 4, according to FOX 13 Seattle.
- Meta: About 330 roles were eliminated in the Seattle region, according to a filing with the state Employment Security Department that KUOW reported in January 2026.
For the wider picture, the Seattle-King County Workforce Development Council's October 2026 index counts 6,912 King County workers affected by WARN notices so far this year, about two-thirds of them in the information sector. That is behind the same point in 2023 and 2025, but ahead of 2024. Nationally, Challenger, Gray & Christmas counts 171,501 announced tech job cuts through October 2026, up 21% from the same period in 2025, as reported by Fast Company.
One caution on all of this: announced cuts are not the same as local, permanent job losses. WARN filings count positions at a site, and some of those workers are relocated, rehired elsewhere in the company, or find new roles. I'm treating these as signals, not as a count of households under pressure.
What the job data says
The same Workforce Index shows King County employers posted 35,662 jobs in September 2026, roughly even with September 2025. Postings that ask for AI skills were up 72% from a year earlier, and Amazon was still the top poster with 2,407 openings. King County's unemployment rate was 4.8% in September (preliminary), up from 4.7% in August, and the index notes the labor force grew by about 21,000, so part of the uptick reflects more people looking for work. For context, the Seattle-Tacoma-Bellevue rate was 5.1% in November 2025, according to the BLS figure KUOW cited. So the job market is softer than it was, but it's not a freefall. Layoffs and hiring are both happening at the same time, often at the same companies.
What happened after the 2022-2023 layoff wave
The earlier wave is the closest thing we have to a test. Seattle Met's February 2023 reporting on January 2023 data showed Bellevue (east of I-405) with a median sale price of $875,000, down about 42% from January 2022, and Kirkland and Bridle Trails at $1,175,000, down about 22%. Months of inventory were roughly 2.9 in both places. Those year-over-year drops look dramatic, but the article notes they came right after a roughly 100% year-over-year jump in Bellevue in January 2022. In other words, a lot of that move was a hot spring-2022 peak unwinding while mortgage rates were climbing quickly, so I'd be careful about pinning it on layoffs alone.
What came next is just as relevant. A Windermere year-end review using NWMLS data put the 2024 Eastside median at a record $1.6 million, up 11% for the year. And the Seattle Times reported that King County's 2024 single-family median hit a record $950,000, up 8.5%, with listing supply still near its lowest level in more than a decade. So the area saw layoffs through 2023 and 2024, and prices still ended 2024 at record highs. I can't tell you layoffs had no effect. Rates, inventory and buyer confidence were all moving at once. What the record does show is that layoffs alone did not produce a lasting collapse in that period.
Which is the key caveat: 2022-2024 isn't a template for what happens next. Rates then were rising from very low levels. Freddie Mac's survey had the 30-year fixed at 7.11% on November 12, 2026, down from 7.18% the week before and up from 6.24% a year ago. That's a different starting point.
What the market is showing right now
This is where I'd pay the most attention, because the data is current. NWMLS's October 2026 snapshot has the King County median at $851,250 for residential and condo combined, down 4.1% from a year ago. Single-family was $925,000, down 7.2%, and condos were $465,000, down 15.5%. Active inventory was up 32.8% year over year. Beyond WA's King County report puts the market at about 4.1 months of supply, a median of 33 days active, and a 98.2% sale-to-list ratio. (The two sources define and time their medians a little differently, which is why the exact dollar figures don't match.)
On the Eastside specifically, Get Happy at Home's analysis of NWMLS data for July through September 2026 (single-family resales) showed Bellevue at a $1,700,000 median, flat from a year earlier, and Kirkland at $1,368,750, down 11.4% from $1,545,000. Months of inventory were 4.7 in both cities, versus 2.9 in Bellevue and 3.2 in Kirkland a year earlier, and showings per listing fell. That analysis also found same-house prices (repeat sales of the same property) were down about 10.6% in Bellevue and 8.5% in Kirkland year over year. A flat median alongside lower same-house prices is a good reminder that medians depend on which homes happened to sell that quarter.
Put plainly: buyers have more choices and more time than they did a year ago, and prices have softened. Whether layoffs are the cause is harder to say. A 7%-plus mortgage rate is a big part of this picture too, and I haven't seen a clean way to separate the two.
Indicators I'd watch
If you're trying to read the market yourself, here are the numbers that tend to move first:
- Months of inventory. Under about 3 generally favors sellers, 4 to 6 is balanced, and above 6 favors buyers. Eastside single-family is around 4.7 per the analysis above. Watch whether it keeps rising over the next few months or levels off.
- Days on market and price cuts. If homes sit longer and more listings reduce their price, that's a sign of cooling demand. Look at your specific neighborhood and price band, not the county average.
- Sale-to-list ratio. The share of asking price that sellers actually get. It was 98.2% countywide in Beyond WA's October data.
- New listings. A jump in new listings can mean motivated sellers. Rising inventory because homes aren't selling is a different story than rising inventory because more people list.
- Job postings and WARN notices. The Workforce Development Council updates its index monthly. Postings holding steady while layoffs continue suggests a reshuffling rather than a drop in demand.
No single number settles it. I'd look for several moving the same way across a few months.
What this means for buyers and sellers
If you're buying, a slower market can mean more room to compare homes and negotiate on price or terms, though rates are still the main driver of monthly cost. If you're selling, pricing to the current market matters more than it did when homes drew a pile of offers. In both cases, the right answer depends on your timeline, your job situation and your neighborhood, so I'd treat any citywide number as a starting point, not a verdict.
In January I wrote about how Seattle's layoffs and hiring were playing out together. This post is meant as an update with fresher data, and I'll keep tracking it. In part 2 I'd like to dig into specific Eastside neighborhoods and price ranges, if that would be useful.
None of this is tax, legal or financial advice, and past results don't guarantee future ones. Medians and averages can look very different from what any individual home does. If you'd like to talk through what this means for your situation, reach out anytime to set up a quick call.
Sources (pulled November 16, 2026)
Freddie Mac Primary Mortgage Market Survey (Nov 12, 2026); NWMLS Market Snapshot, October 2026; Beyond WA King County Market Report (October 2026 sales); Get Happy at Home analysis of NWMLS/InfoSparks data (Jul-Sep 2026, pulled Oct 2, 2026); Seattle-King County Workforce Development Council Workforce Index (Oct 2026); KUOW (Jan 21, 2026); Spokesman-Review (Nov 4, 2026); FOX 13 Seattle (July 2026); Fast Company (Nov 2026); Seattle Met (Feb 14, 2023); Windermere Mercer Island annual review of NWMLS data (Jan 15, 2025); Seattle Times (early Jan 2025).